

Overview
My Role
Data Analyst / Dashboard Designer
This project started with a request from a Sales Manager who wanted to move from static sales reports to a more flexible dashboard.
Project Type
Sales BI Dashboard
Tech Stack
SQL Server, Google Sheets, Looker Studio
User Stories

Three focused dashboard views

Customer Overview
Highlights top customers, customer distribution, and monthly customer sales behaviour.

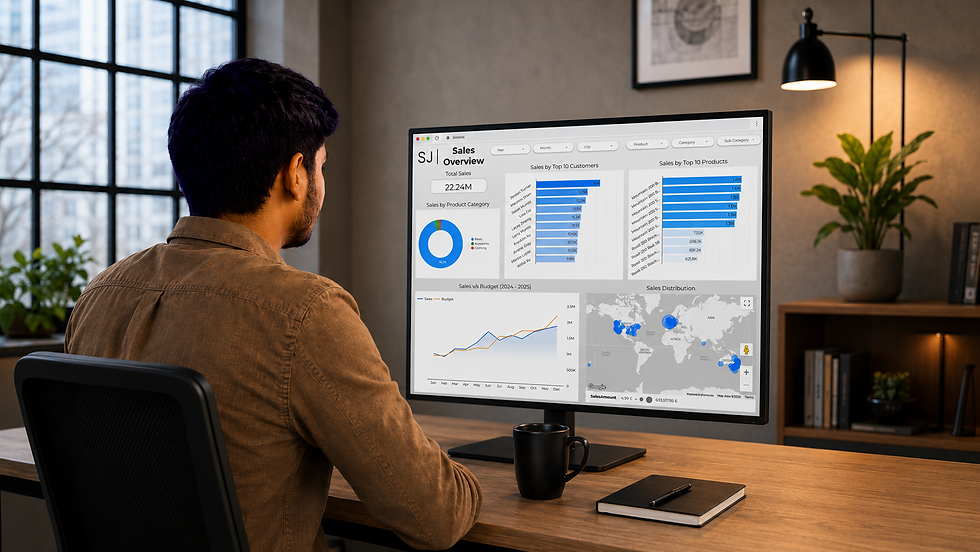
Sales Overview
Tracks total sales, sales trends, top customers, top products, city distribution, and sales vs budget performance.

What the dashboard helps teams do
The final dashboard gives sales teams a faster way to explore performance and make sense of sales, product, customer, and budget data.
Outcome points:
- Sales and budget in one view
- Identify top revenue-driving customers
- See best-performing products and categories
- Explore by time, city, product, and customer
- No forced product-level budget comparison
Want the full technical breakdown?
I wrote a detailed blog covering the full build process, from SQL extraction and Google Sheets preparation to Looker Studio blending, limitations, and dashboard design decisions.
Hildburghauserstr. 98, 12209, Berlin, Germany